How can retailers benefit from in-store kiosks?
Retail kiosks help shoppers check prices, understand products, compare alternatives, place orders and complete routine tasks without waiting for every answer. For the retailer, the value can be better service, more checkout capacity, recovered sales and less repetitive work. Choose a kiosk around the task you want to improve, then measure its effect.
· The figures below are illustrative scenarios, not measured customer results.
Different kiosks solve different store problems
A price terminal, product-information station and checkout kiosk may look similar, but they support different decisions. One screen can combine several functions if the navigation remains simple. Paying for every feature is less useful than making the most frequent customer task work well.
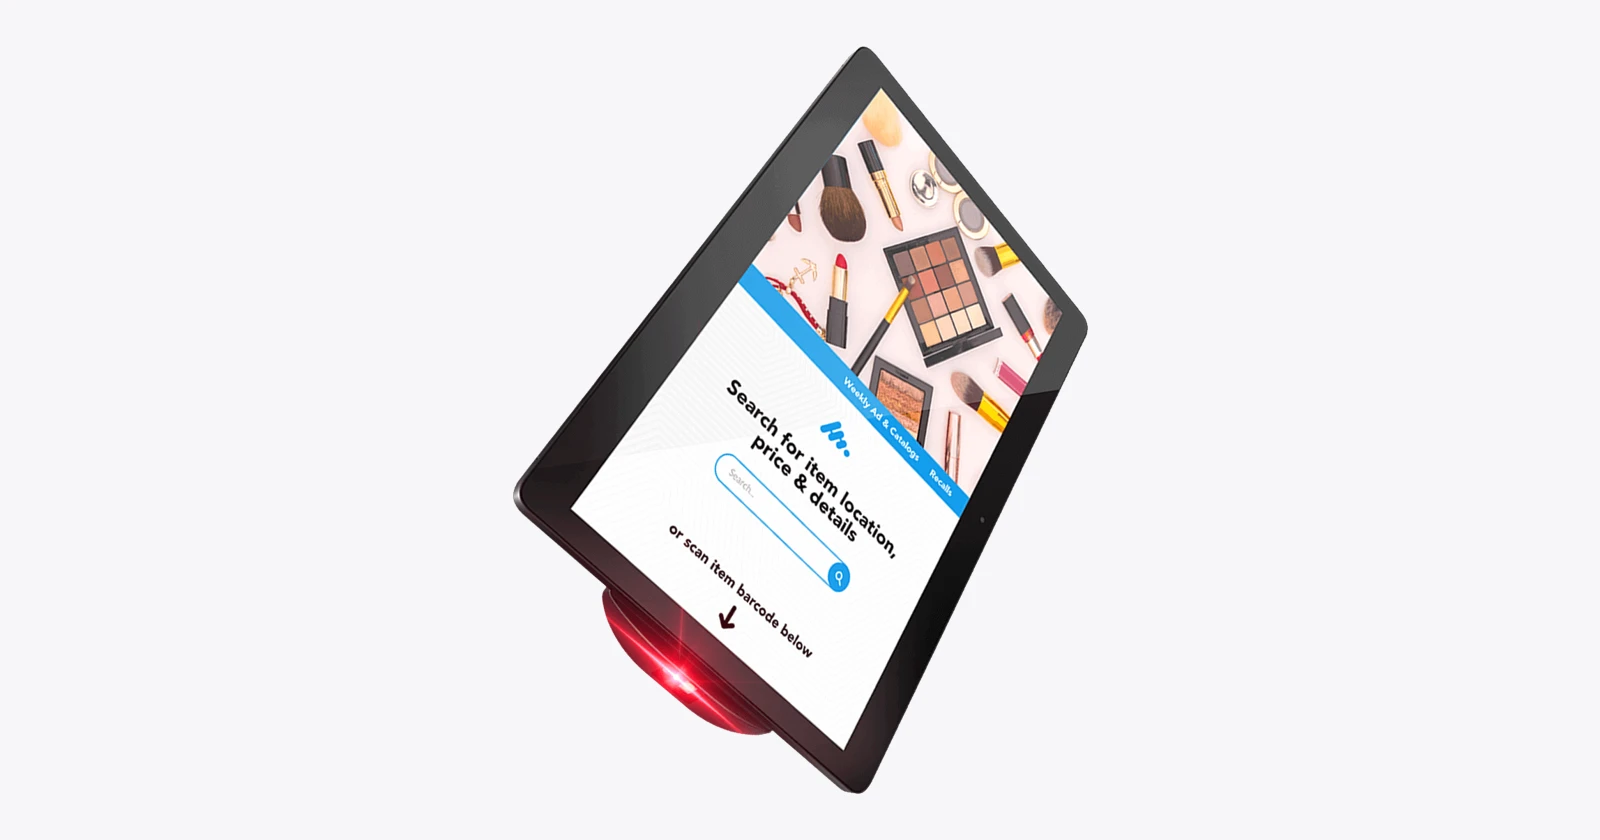
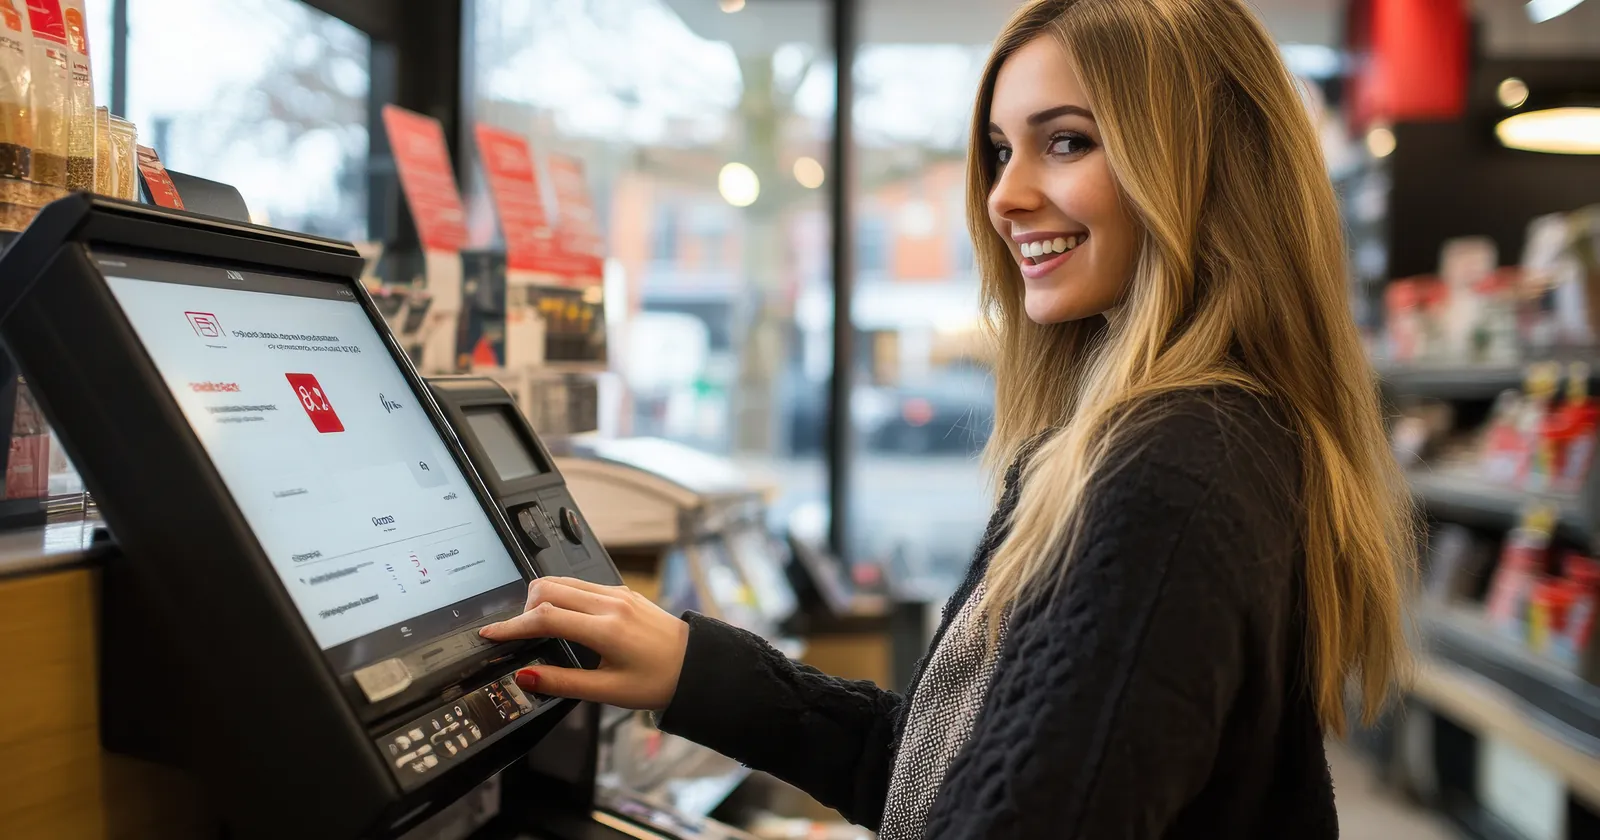
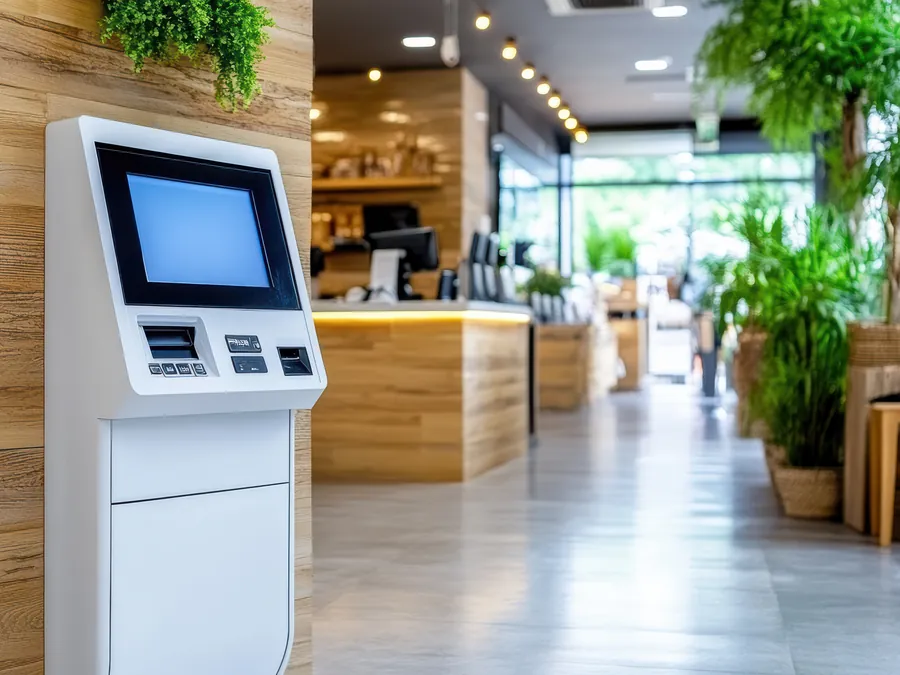
Many of these functions use conventional retail software and integrations; they do not need AI. Images include Elo marketing imagery used with partner permission and illustrative stock photography. They do not document Raptool installations or the financial examples.
Retail kiosk solutions at a glance
| Kiosk type | Main benefit | Example impact |
|---|---|---|
| Product-information and alternative-product kiosks | Help shoppers choose with confidence | €10,512 / year in staff-time valueIllustrative; see assumptions below. |
| Price-check terminals | Give an immediate answer to “How much is this?” | 50% less routine price-query handlingIllustrative; see assumptions below. |
| Self-checkout kiosks | Add checkout capacity for suitable baskets | €15,000 / year illustrative net benefitIllustrative; see assumptions below. |
| Endless-aisle ordering kiosks | Recover sales when the shelf does not have the answer | €15,750 / year in extra contributionIllustrative; see assumptions below. |
| Click-and-collect check-in kiosks | Make collection arrivals easier to manage | €7,000 / year in capacity valueIllustrative; see assumptions below. |
| Returns and exchange kiosks | Prepare routine returns before the counter | €3,500 / year in capacity valueIllustrative; see assumptions below. |
| Loyalty and offer kiosks | Make relevant benefits easier to use | €3,360 / year in extra contributionIllustrative; see assumptions below. |
Read the numbers correctly: Staff-time value is capacity until actual paid costs fall. Additional sales are counted as contribution after variable costs, not as profit equal to revenue. These examples use different assumed store volumes and must not be added into a single forecast.
01. Product-information and alternative-product kiosks
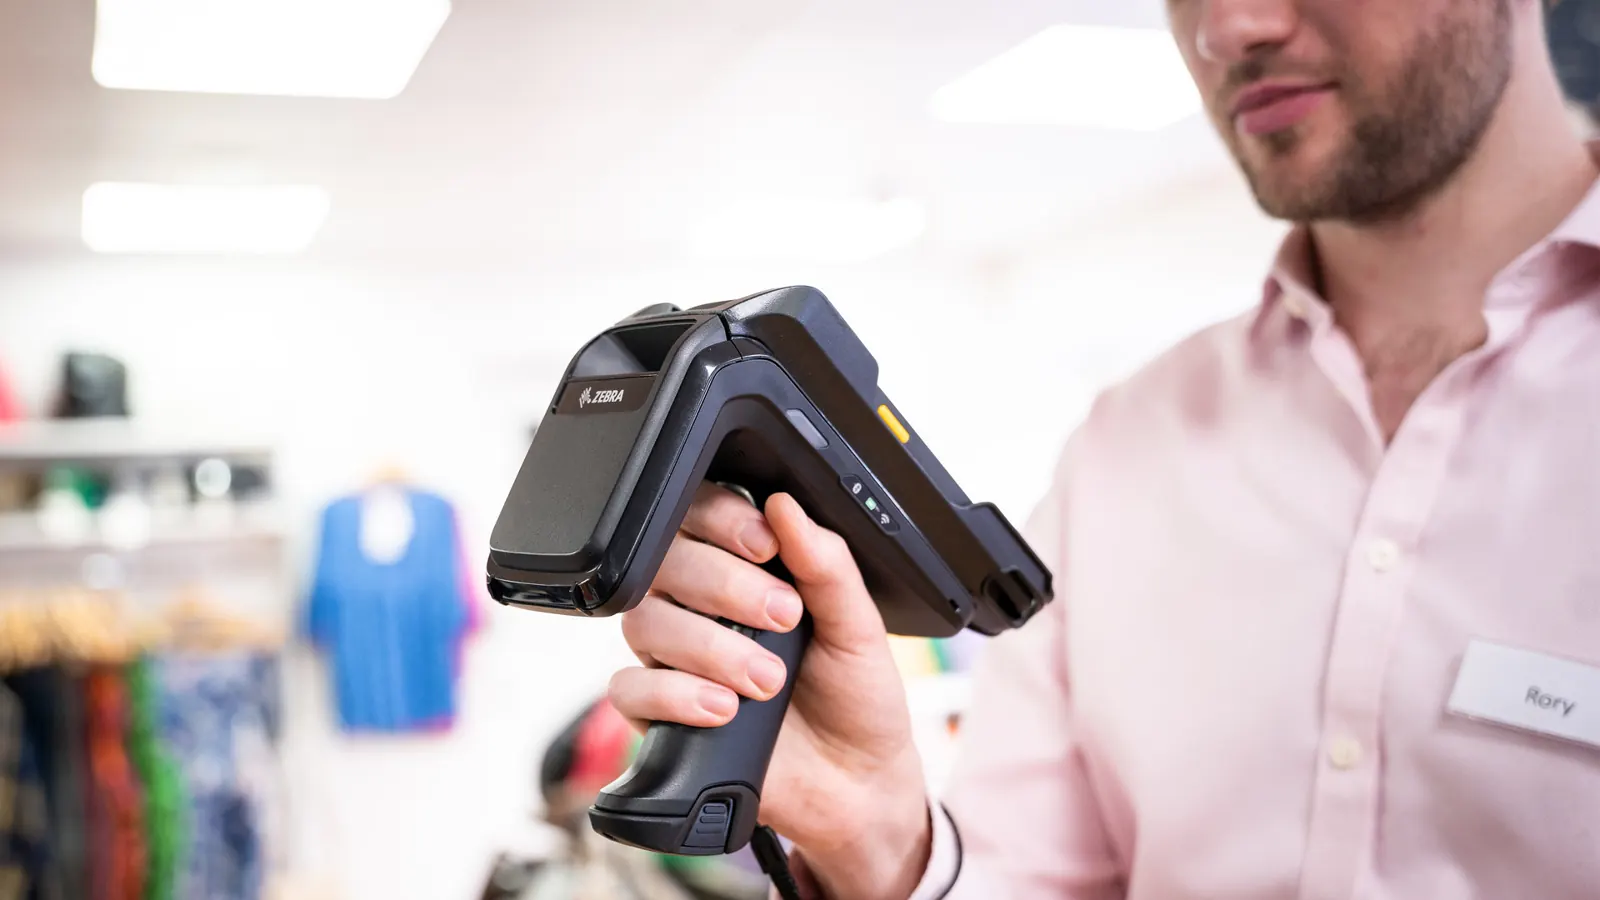
Scan a barcode to see the right product. A customer picks up a product, scans its barcode and sees specifications, sizes, colors, compatibility, stock availability and relevant alternatives. If the desired item is unavailable, show a genuinely suitable substitute with its current price and location. For example, a shopper scanning a lamp can compare its fitting and dimensions with other models rather than leaving to research on their phone.
For the retailer, the opportunity is fewer routine questions and fewer abandoned purchase decisions. Good alternatives can recover a sale; misleading recommendations can lose trust. Zebra describes product lookup as an interactive-kiosk application. Alternatives and comparisons depend on the retailer’s catalog and application integration; they are not automatic features of every terminal.
Illustration: 60 lookups/day × 2 minutes of avoided staff handling × 365 days ÷ 60 × €24/hour = €17,520. If only 60% genuinely replace staff interactions, the time value is €10,512. It becomes cash savings only when paid hours or other spending fall.
Prove the benefit: Track completed lookups, follow-up help requests and purchases after viewing alternatives. Keep barcode-to-SKU mapping, product content and stock feeds current.
02. Price-check terminals
A simple price check can be the right starting point. A dedicated terminal lets shoppers scan an item and see its current selling price, applicable promotion and unit price where relevant. It serves a narrower task than a product-information kiosk and can be easier to understand in a busy aisle.
Customers can check an unclear label without finding a member of staff or joining a checkout queue. Staff can spend more time on replenishment and complex service. Use the same price source as the tills, with clear promotion and membership conditions.
Illustration: a store receiving 40 price questions/day avoids 20 through the terminal. At 90 seconds each, that frees 30 minutes/day, or 182.5 hours/year. At €24/hour, the capacity value is €4,380/year; this is not guaranteed cash savings.
Prove the benefit: Measure unresolved scans, staff queries and price discrepancies. A product-info kiosk can include this function, so do not count both examples as independent savings.
03. Self-checkout kiosks
Let shoppers scan, bag and pay. Customers scan their purchases and complete payment themselves, while an attendant helps with exceptions. Self-checkout can suit small, uncomplicated baskets and periods when queues are the main bottleneck. NCR Voyix describes guided self-checkout software. Basket mix, payment needs and intervention frequency determine whether it actually improves the visit.
More checkout positions do not automatically mean fewer paid hours. Staff still supervise, handle failed scans, approve restricted purchases and resolve payment problems. ECR Retail Loss’s 2026 research examines the relationship between self-checkout and retail losses, so shrink belongs in the business case.
Illustration: 1,000 genuinely avoided paid hours/year × €24 = €24,000 gross labor saving. Subtract €5,000 annual support/software and €4,000 incremental losses: €15,000/year before equipment and installation. These figures are assumptions, not a retailer case study.
Prove the benefit: Measure queue time, paid staffing, interventions per 100 transactions, uptime and incremental loss together. Retain a convenient staffed option and include training and loss controls in the pilot.
04. Endless-aisle ordering kiosks
Sell beyond the stock in this store. A shopper finds the right style but not the size. The kiosk shows availability elsewhere, a delivery promise and the full price, then lets them order for delivery or collection. Product lookup answers a question; endless aisle lets the shopper act on the answer.
The opportunity is incremental contribution from purchases that would otherwise be lost. Adyen’s endless-aisle documentation describes the need for an inventory-connected app or web interface alongside payments. Accurate fulfillment promises matter as much as the screen.
Illustration: recover 3 genuinely incremental orders/day × 350 trading days × €60 average order × 25% contribution margin after variable fulfillment/returns costs = €15,750/year before kiosk costs. Revenue is €63,000; contribution is not the same as revenue.
Prove the benefit: Compare against a control store or period. Exclude orders that would have happened online anyway, and track cancellations, delivery costs and returns.
05. Click-and-collect check-in kiosks
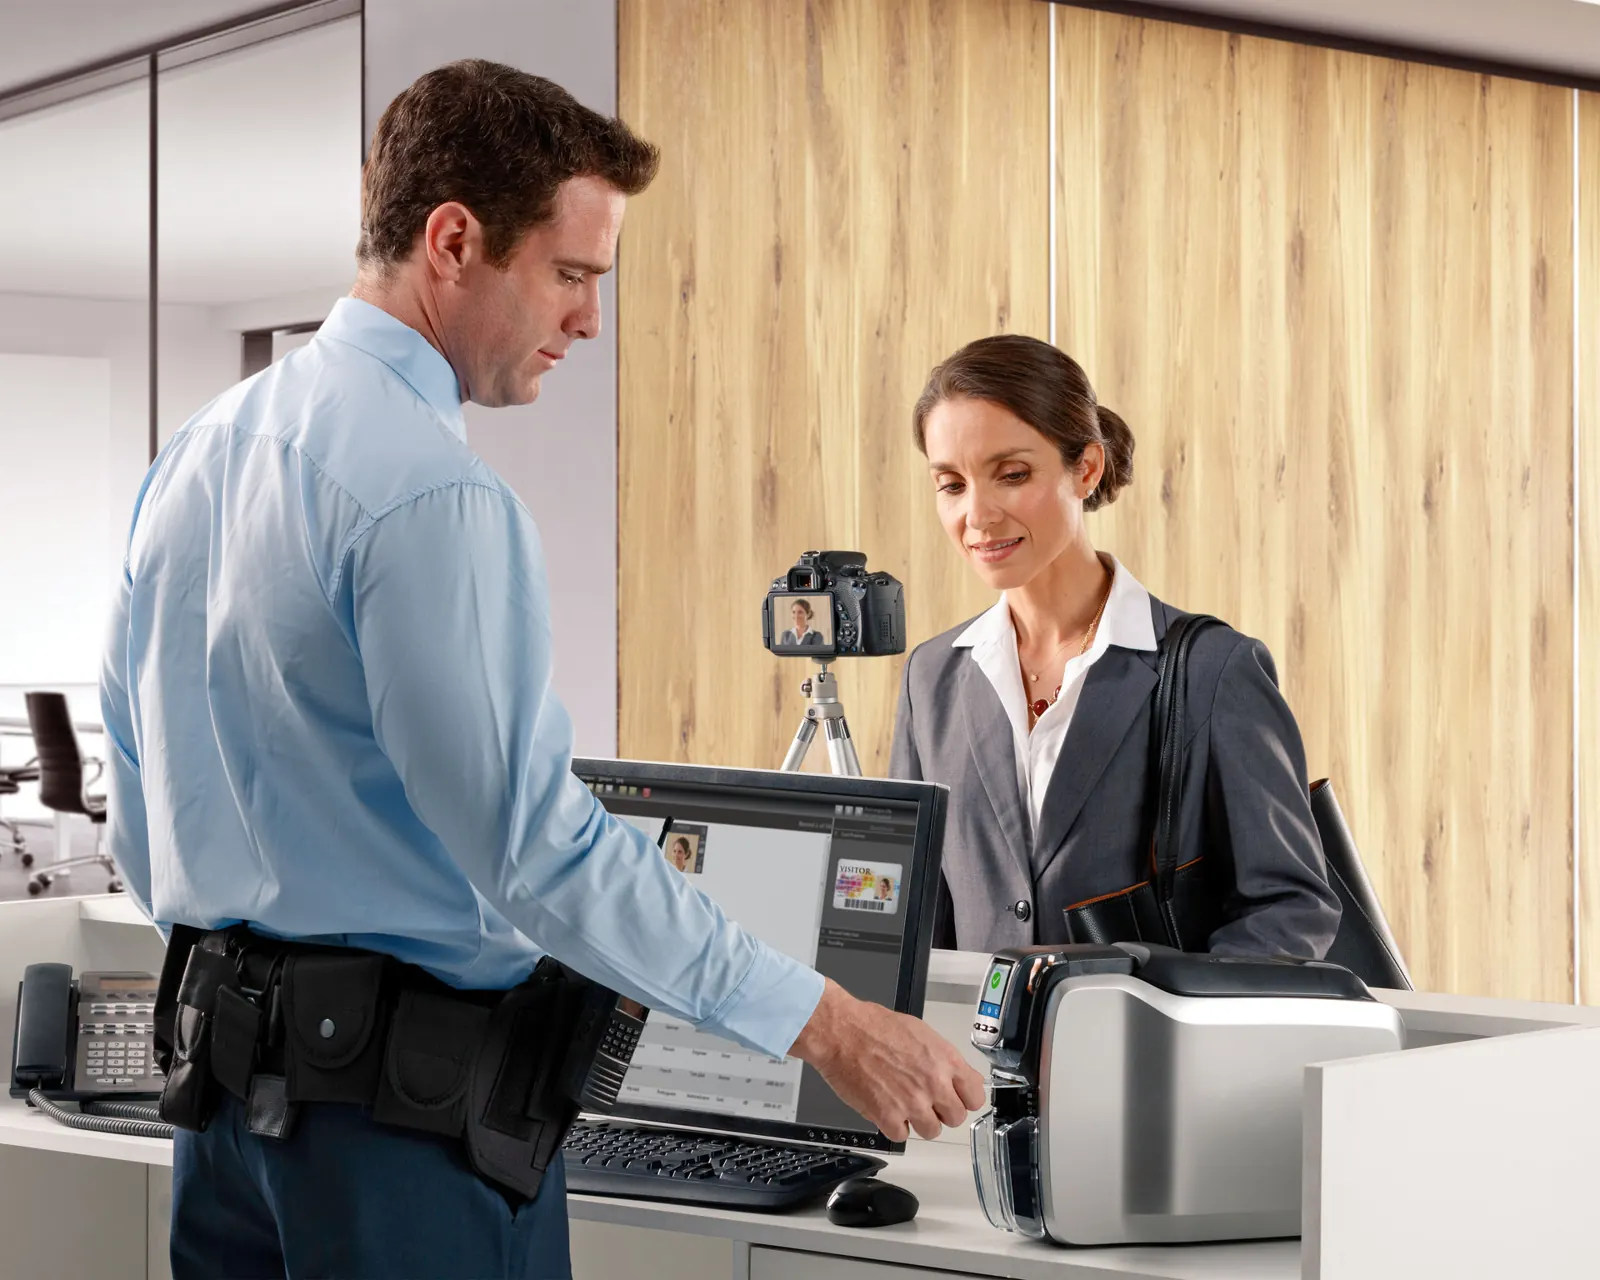
A check-in kiosk starts the handover. Customers scan a collection code or enter a reference to tell staff they have arrived. The system routes the request to the collection team and displays an expected next step. A check-in screen identifies and queues arrivals; a locker adds a separate physical handover mechanism.
Staff can prepare the handover without repeatedly asking customers for details at a busy counter. The benefit depends on linking the kiosk to live order status and a workflow staff actually monitor.
Illustration: 50 collections/day × 1 minute less counter handling × 350 days ÷ 60 × €24/hour = €7,000/year. Order retrieval and identity checks still take time. Reassigned minutes are capacity, not an automatic payroll reduction.
Prove the benefit: Track arrival-to-handover time, missing orders and counter interruptions. Do not promise instant collection unless the stock and staffing support it.
06. Returns and exchange kiosks
Collect the details once. Customers scan a receipt or order reference, select the item and reason, and receive instructions. Staff can then inspect the goods and complete the approved next step. Zebra includes returns processing among interactive-kiosk uses. A screen does not itself establish eligibility or inspect condition.
Pre-entered details can reduce repetitive administration. An exchange suggestion can retain a sale when it solves the customer’s need, but the return route should remain clear and fair.
Illustration: 25 returns/day × 1 minute of avoided administrative handling × 350 days ÷ 60 × €24/hour = €3,500/year before kiosk costs. Include exceptions and remaining inspection time.
Prove the benefit: Measure total processing time, repeated data entry and error rates. Apply your actual returns policy, protect customer details and hand exceptions to staff.
07. Loyalty and offer kiosks
Help shoppers access offers while they are in store. A shopper identifies their loyalty account, checks available benefits or receives a relevant offer. The best flow is short: explain the offer, show its conditions and provide a simple way to use it. Guest shopping should still work.
A targeted offer may add an incremental purchase. But discounting purchases customers already planned can reduce margin. Evaluate contribution after discounts rather than celebrating redemption volume alone.
Illustration: 4 incremental purchases/day × 350 days × €12 additional revenue × 20% contribution margin after discounts and variable costs = €3,360/year before kiosk costs. Verify incrementality with a control group.
Prove the benefit: Track incremental margin, failed redemptions and requests for help. Clear session data after each customer and avoid exposing account information on a shared screen.
Where Elo touchscreens fit into a retail kiosk solution
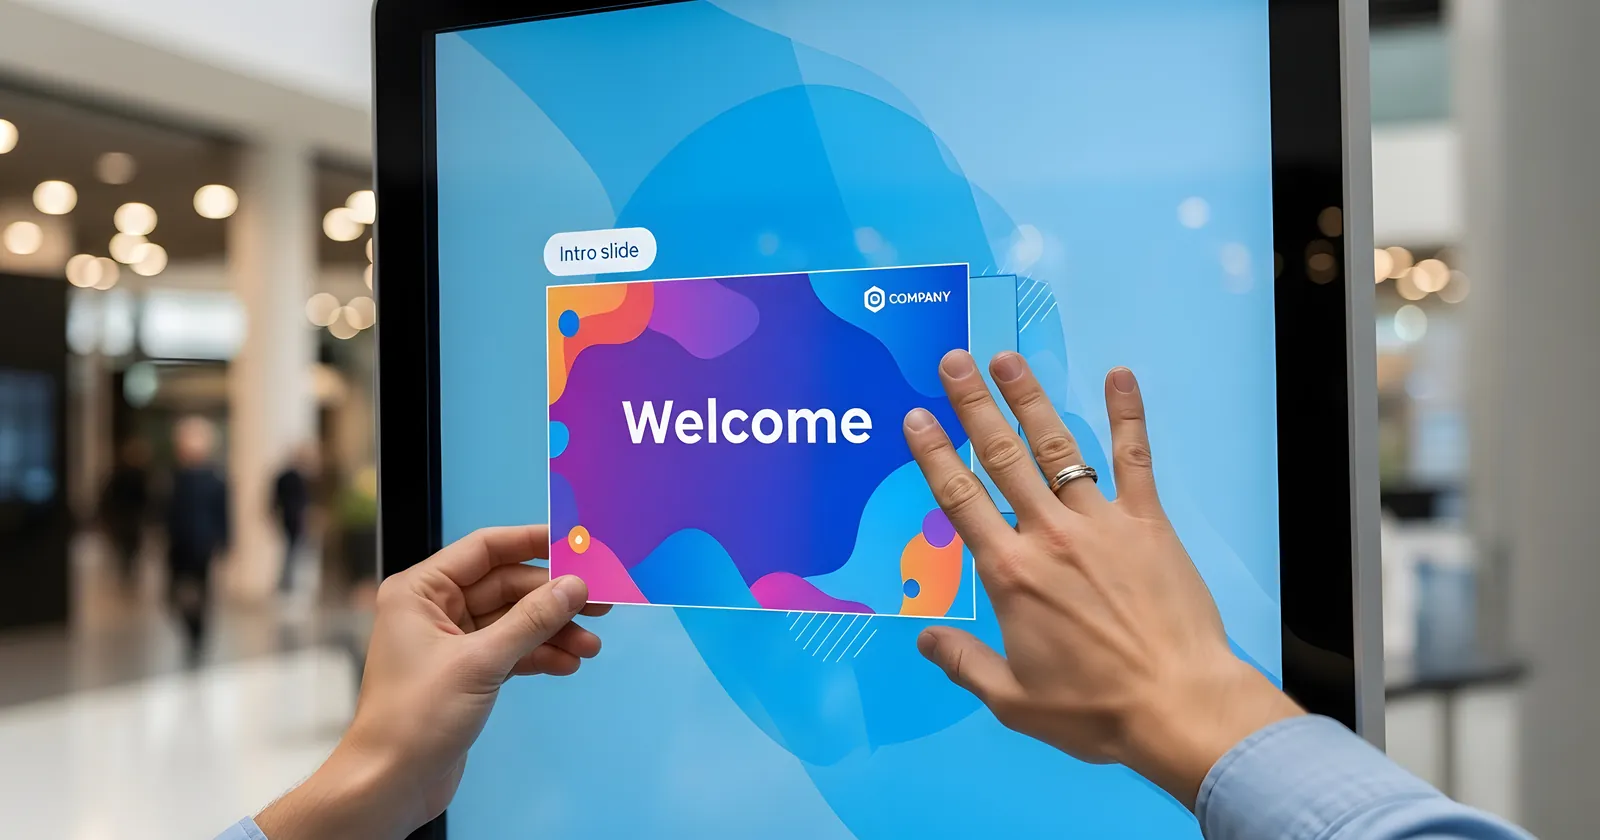
Elo’s endless-aisle retail solutions provide examples of interactive displays for browsing a wider assortment in store. A touchscreen can give shoppers a clear place to compare products and continue an order when the local shelf cannot meet their needs.
For barcode product information, price checks or self-checkout, choose the display, scanner and payment peripherals around the task. The application still needs the right catalog, price, stock and transaction connections. Hardware alone does not supply alternative-product recommendations or establish a faster checkout.
Elo imagery is used with permission confirmed by Raptool as an Elo partner. Shown hardware and screen content illustrate the topic; the savings examples remain hypothetical.
Calculate the return before rolling out
Start with a baseline: how many customers need help, where queues form, how many sales are lost to missing stock and how long exceptions take. Pilot one flow in one store, then compare comparable trading periods or a control location.
- Annual net benefit = verified avoided cash costs + incremental contribution − recurring operating costs.
- Include devices, mounts, scanners, payment equipment, installation, integration and training in one-time investment.
- Include software, maintenance, connectivity, consumables, support and relevant loss/payment costs in recurring costs.
- Simple payback in months = one-time investment ÷ annual net benefit × 12.
Worked self-checkout example: A €30,000 installation generating the illustrative €15,000 annual net benefit above has a 24-month simple payback. If the avoided paid hours do not materialise, recalculate the case rather than treating reassigned time as savings.
What makes an in-store kiosk useful?
Accurate data: Use consistent prices, promotions, product identifiers and live stock. State delivery and collection promises honestly. A fast screen with unreliable information creates more staff work.
A short customer journey: Make the scanner obvious, show confirmation when a barcode is read, use readable text and offer a clear next step. Keep controls reachable and provide an easy route to human help.
A reliable store workflow: Plan placement, connectivity, maintenance, receipt handling and exception ownership. If a kiosk requests assistance, someone needs to receive that request and respond. If connectivity fails, explain what the customer can do next.
Appropriate integrations: Product information needs catalog data; stock lookup needs inventory data; ordering needs fulfillment; checkout needs approved payment and POS integrations. Choose the smallest reliable combination that solves the problem.
Start with the question customers ask most
For a comparison-heavy store, begin with barcode product lookup and useful alternatives. For frequent price questions, a compact price checker may be enough. For missing sizes and colors, evaluate endless aisle. For checkout congestion, test supervised self-checkout against the actual basket mix.
Good kiosks help customers move forward and leave staff available for the moments where personal service matters most.
Tags
Explore a kiosk workflow for your store: product lookup, price checks, ordering or checkout.
Book a demoRetail kiosk questions answered
What is the difference between a price checker and a self-service kiosk?
A price checker usually displays the price of a scanned product. A broader self-service kiosk can also show product details, alternatives, stock, ordering or other services, depending on its software and integrations.
Can customers scan a barcode to see alternative products?
Yes, if the kiosk application maps the barcode to a product and has current catalog and availability data. Alternatives should match the shopper’s requirements and clearly show price and stock. A barcode scanner alone does not provide that functionality.
Do self-checkout kiosks always reduce costs?
No. Avoided paid labor must exceed support, equipment, supervision, payment and incremental loss costs. Measure basket speed, interventions and loss in a pilot. Faster service can be useful even when staffing costs do not fall.
Which retail kiosk should a store introduce first?
Start with the most common unresolved task: price checks for frequent price questions, product lookup for comparison-heavy ranges, endless aisle for stock gaps, or self-checkout for suitable baskets and checkout queues.
How do you calculate kiosk payback?
Annual net benefit equals verified avoided costs plus incremental contribution, minus recurring kiosk and operational costs. Divide one-time investment by annual net benefit and multiply by 12 for simple payback in months. Avoid counting overlapping benefits twice.
Sources are linked beside the relevant claims. Numerical scenarios are our illustrations. Feature availability depends on the chosen hardware, software and integrations; this article does not claim all these features are included in Raptool.